

A localhost server dashboard gives your browser-based tools one home: see which configured apps are available, start their launchers, open the correct address, and stop them when you are finished. I built Local Control on my Mac with Codex because remembering terminal windows, project folders, and port numbers had become a job of its own.
I keep creating small applications for my own workflow. Some help with content, some organize footage, and others are dashboards I use for a specific task. They look like websites, but their servers run on my computer.
The problem starts when there are several of them. Which tool uses port 3000? Did I leave another one running? Where did I put its start script? A bookmark remembers the address, but it cannot tell me whether the server behind that address is available.
My solution is a visual control panel. The interface says Workbench, while the launcher is called Local Control. This is a personal utility, not a publicly released download. Here is how it works, where it is useful, and how you can build a similar dashboard for your own Mac.
What a localhost dashboard actually does
Localhost refers to your own computer. An address such as http://127.0.0.1:4610 points to a service there, and the number identifies its port. Opening that address does not start the application; something must already be listening.
My dashboard maintains a list of services with names, launcher paths, and URLs. Each row has Start or Stop and an Open button. A summary counts the configured services whose addresses respond. Selecting a row brings up its details, with options to reveal the launcher in Finder, diagnose its state, or repair and restart it.
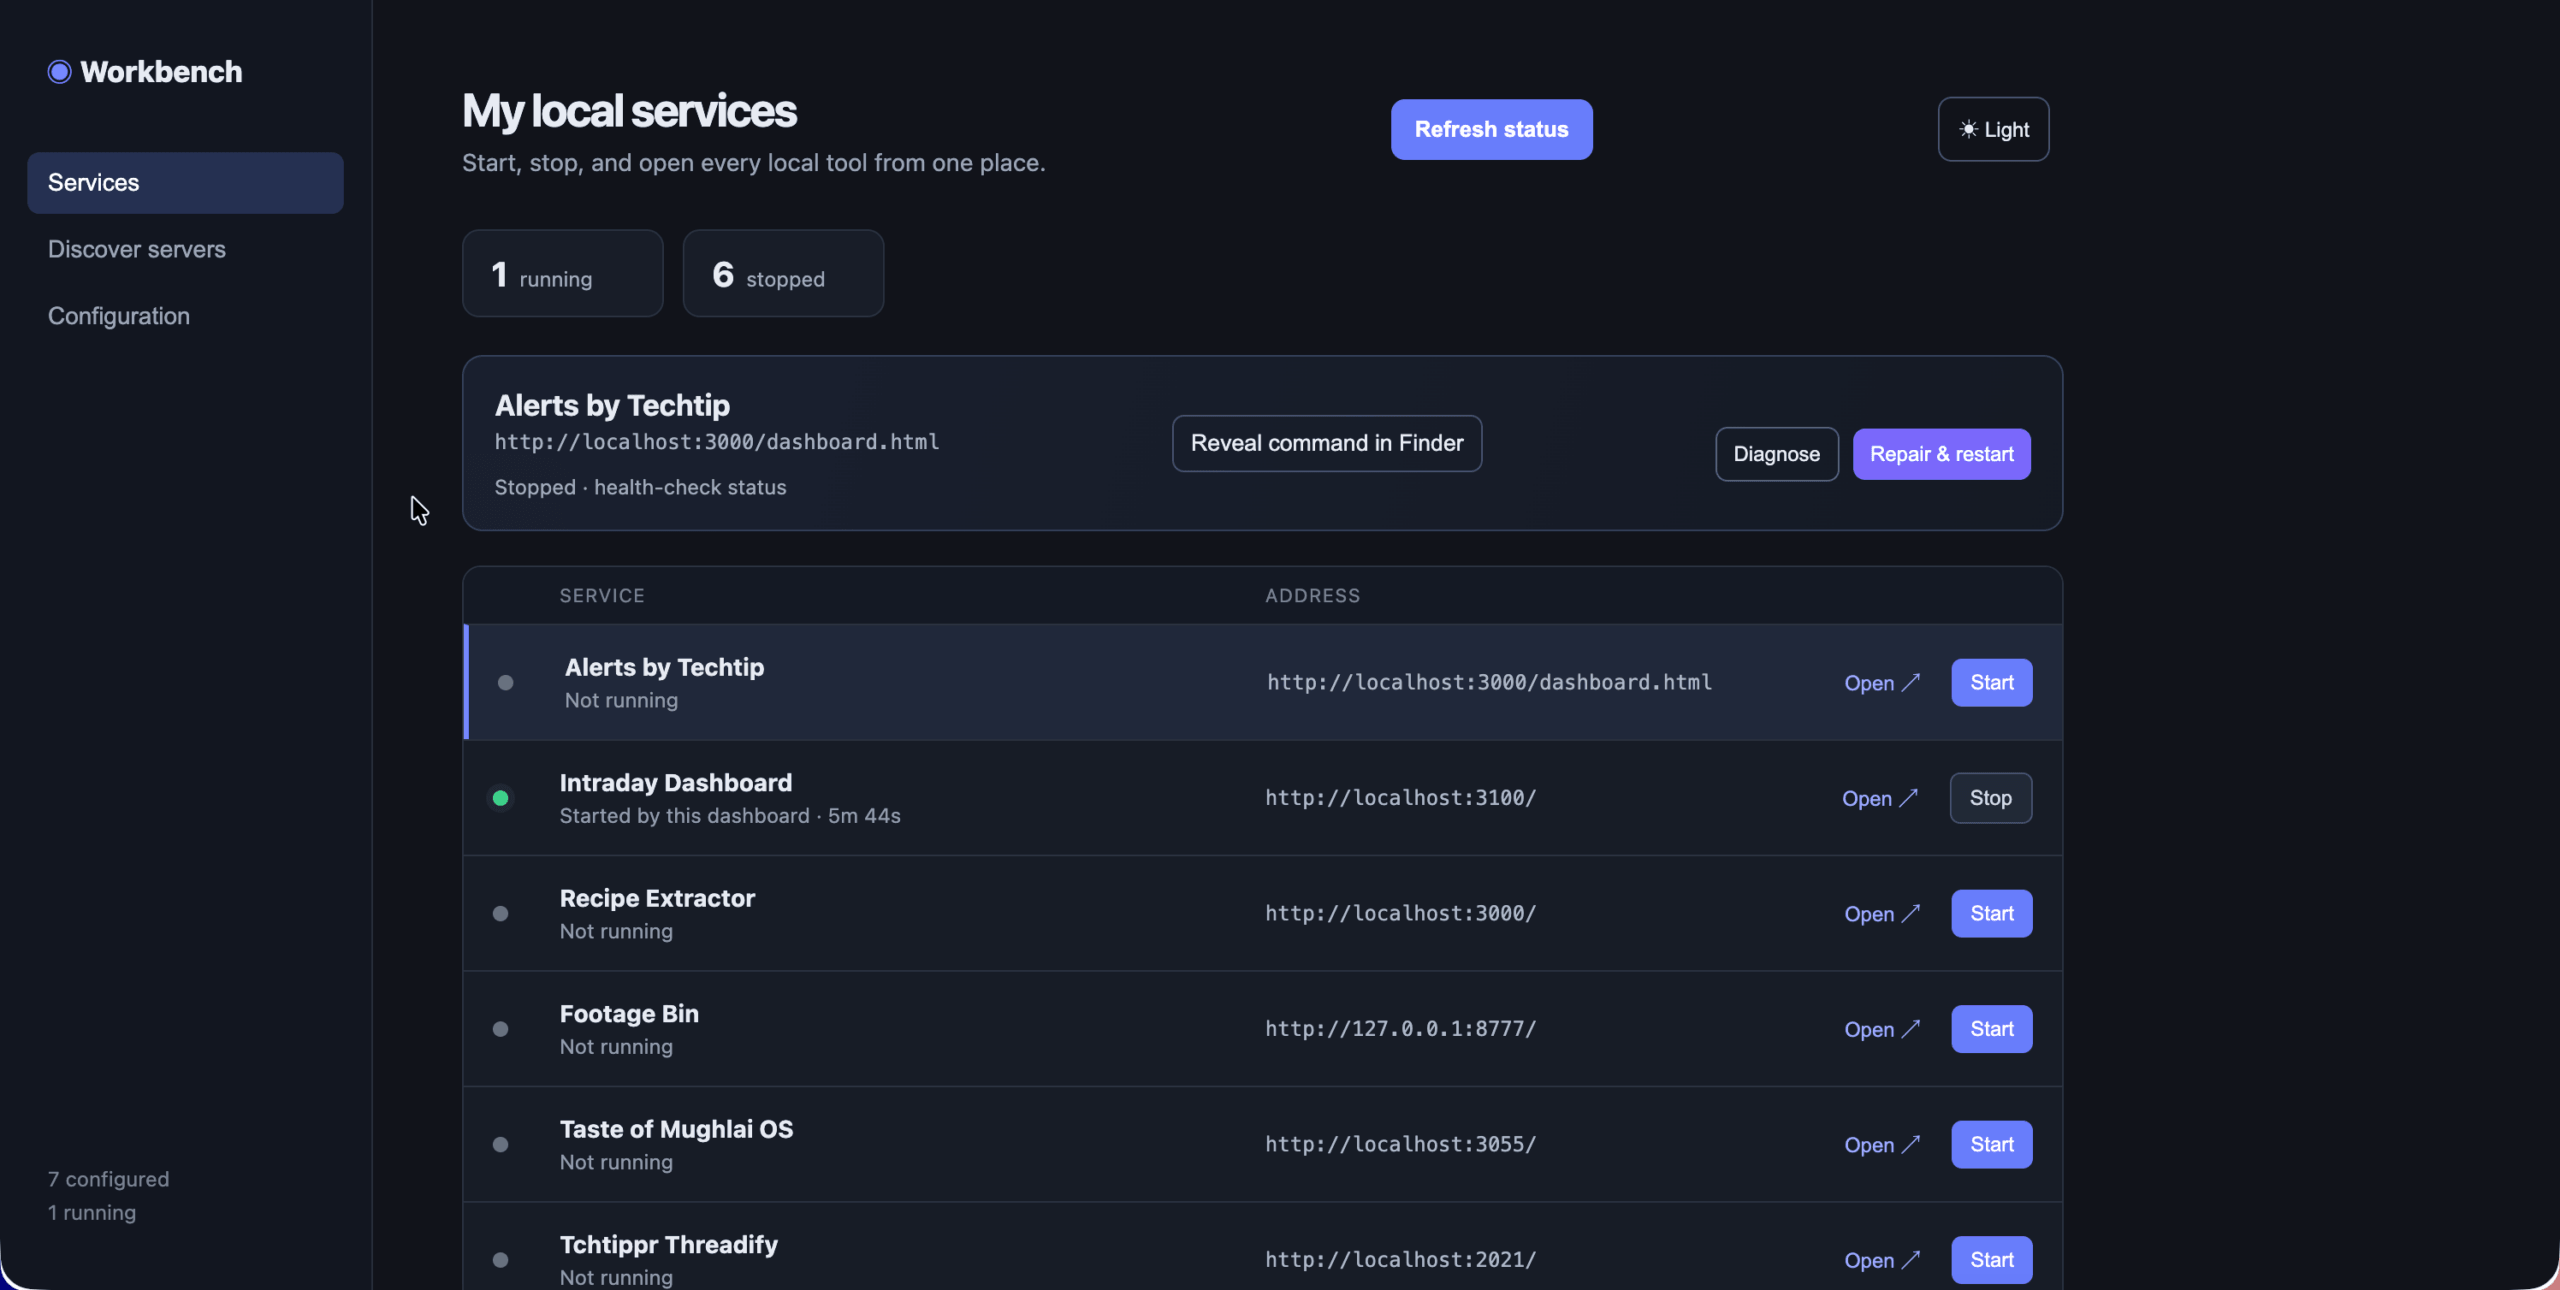
There are two parts: the browser interface and a small local Node.js server. The interface sends requests to the helper, which launches approved scripts and checks application URLs. Node provides child-process APIs for this work. A standalone HTML file does not have that process-control capability.
The helper listens on 127.0.0.1:4610, not a public network interface. My Mac launcher starts it in the background if it is absent, then opens the dashboard in Chrome. The application folder still needs to be present; the launcher is not a completely self-contained app.
Four different workflows where it helps
1. Content creators with several personal tools
A creator might use a recipe extractor, a footage organizer, and a publishing helper on the same machine. None needs to stay open throughout the day. The dashboard makes it easy to start the tool for the current task and stop it afterward.
This is my main use case. I want to work on content, not reconstruct how each app launches. Meaningful service names are more useful than a collection of localhost bookmarks that all look similar.
2. People building apps with AI coding tools
When you build prototypes with Codex or another coding assistant, generating an app can be easier than remembering its runtime setup a month later. One project uses Node, another Python, and a third has a custom shell launcher.
A common dashboard preserves those differences behind a consistent interface. It does not replace project documentation, but it reduces the friction of returning to an experiment. You still need separate ownership rules if two coding assistants are editing the same project.
3. Developers switching between projects or demos
A developer preparing a client demo can name each project, verify its address, and open the correct app without searching terminal history. Separate frontend and backend services can have separate rows, although this simple dashboard does not automatically coordinate dependencies between them.
The important preparation is assigning stable ports. A dashboard becomes confusing if a development server silently chooses another port while the saved URL stays unchanged.
4. Learners keeping small experiments organized
If you are learning web development, you may accumulate tutorials, test APIs, and small utilities. A visual list connects each project name to its launch command and browser address. It also makes the difference between “the files exist” and “the server is running” easier to understand.
Start with two known projects. Adding every background process on your computer would create a noisier and riskier tool, not a better learning experience.
How to set up your own local server dashboard
Step 1: Make a small inventory
For each app, record its name, project folder, working start command, browser URL, and reliable stop method. Run its existing launcher once yourself to confirm it works. The control panel should organize a working workflow before it tries to automate one.
Use absolute paths, and put launchers in a stable location. Finder aliases are handy for collecting shortcuts, but the configuration needs the actual executable or script path. Do not paste passwords or API keys into a launcher that you plan to share.
Step 2: Install the runtime and create a project
Install a supported LTS release from the official Node.js download page. Check node --version and npm --version in Terminal. Each managed application still needs its own dependencies; installing Node for the dashboard does not install everything your other projects require.
Create a dedicated Local Control folder, open that folder as a local coding project, and use the prompt below. Ask the assistant to explain its files before testing. My implementation uses Node’s built-in modules, a services.json configuration, and HTML, CSS, and JavaScript in a public directory.
Step 3: Add one service manually
In Configuration, enter a readable name, choose its command file, and set the exact Open URL. The following illustrates the core configuration fields in my version. Replace the sample path and address with your own; this is configuration data, not a complete dashboard implementation.
[
  {
    "id": "example-tool",
    "name": "Example Tool",
    "command": "/absolute/path/to/start.command",
    "url": "http://127.0.0.1:3100/"
  }
]
An optional stop command needs particular care. A launcher may create child processes, or the app may have started outside the dashboard. Prefer a project-specific shutdown method that verifies the process identity rather than stopping whatever happens to occupy a port.
Step 4: Test Start, Open, and Stop
For a generated project with a start script, run npm start inside its dashboard folder. My version opens at http://127.0.0.1:4610. Click Start for the test service, wait for its response, and choose Open. Then Stop it and refresh the status.
Also test a missing launcher, an unavailable port, and a service already running from Terminal. A successful button click means a request was accepted; it does not prove the underlying application finished starting or shutting down.
Step 5: Discover more launchers, then review them
My Discover servers screen searches macOS Spotlight-indexed locations for likely launcher scripts, including .command and .sh files. It looks for familiar start commands and local URL or port clues. I review a result, reveal it in Finder if needed, and add it individually.
This is launcher discovery, not a complete scan of every active server. Unindexed folders, unusual commands, containers, and dynamically selected ports can be missed. Verify the detected URL before relying on it.
Step 6: Add a convenient Mac launcher
Ask your coding assistant to create a double-clickable launcher that checks whether the dashboard is already available, starts it only when necessary, and opens the browser. It should set the required runtime environment and write startup output to a log.
Keep the launcher and dashboard folder together. Moving the project can break hard-coded paths, so update them and rebuild the launcher afterward. Closing the browser tab does not necessarily stop the helper or the services it launched.
The prompt I would use to build this
This is a reusable build brief based on my dashboard, with stronger safety and testing requirements for a new implementation. It is not a claim that every safeguard below already exists in my personal version.
Build a local server control dashboard for my Mac in this project folder.
Use a browser UI and a small Node.js helper bound to 127.0.0.1 only.
Use a configurable dashboard port, default 4610. Do not expose it to the LAN.

Show configured services with name, URL, launcher path, status, Start,
Stop, Open, Refresh, and Reveal in Finder. Add light/dark mode,
configuration editing, and manual-review discovery of launcher scripts.
Use JSON configuration and validate every field. Execute only approved
launchers; never automatically run a discovered script.

Track process ownership and separate reachable URLs from managed processes.
Verify app identity and process ownership before stopping anything.
Never kill an arbitrary process because it occupies the expected port.
Detect port conflicts, preserve logs, and show starting and failed states.
Handle child processes, helper restarts, and stale PID records safely.
Restrict browser requests with Host/Origin checks and CSRF protection.
Do not accept arbitrary shell commands from unauthenticated requests.

Add Diagnose. Make Repair a confirmed, documented cleanup/restart action,
not an automatic rewrite of application code. Do not delete project files.
Create a Mac launcher that avoids duplicate helper instances.
Keep existing apps unchanged. Test with a disposable sample service first.
Test missing files, slow startup, occupied ports, external processes,
helper restart, and graceful stopping. Provide README setup instructions,
configuration examples, known limitations, and a rollback procedure.
The limitations you should understand
My current helper treats an HTTP response below 500 as available—even a 404. Two services configured with the same port can therefore look available when only one is running. Give apps distinct ports and use an app-specific health response when building a more reliable version.
For Vite projects, its server options document both the port setting and strictPort, which makes startup fail rather than silently selecting another port. Python’s http.server documentation explains explicit port and bind options for simple local servers. Use the relevant option for your app, not a one-size-fits-all command.
My helper tracks launched processes in memory. After the helper restarts, it can still detect responding URLs, but it loses that session’s ownership map and start times. Uptime for an externally started service is therefore unknown. Some configured stop commands also use port-based process lookup; those deserve review before reuse.
Diagnose checks the URL, launcher existence, and relevant PID records. Repair & restart performs configured stop/cleanup behavior, removes stale PID records it recognizes, and relaunches the service. It does not install missing packages, fix a broken script, resolve every port conflict, or repair application code.
Finally, this helper can execute local commands. Loopback binding reduces network exposure but is not a complete security boundary. My inspected version does not include explicit Host/Origin validation or CSRF protection. Keep it private; the prompt asks for these protections in a new build. Do not publish or tunnel this control endpoint.
Pros and cons of this approach
| Advantages | Trade-offs |
|---|---|
| One visual home for unrelated browser tools | Each app still needs accurate configuration and working dependencies |
| Start, stop, and reopen apps without hunting for scripts | Reliable shutdown requires verified process ownership |
| Flexible enough for Node, Python, and custom launchers | Finder, Spotlight, and the launcher are Mac-specific |
| Runs locally without a separate cloud dashboard account | You maintain the helper, paths, logs, and security safeguards |
The benefit is organization, not a guaranteed speed or battery improvement. Stopping an unnecessary service may free resources, but that depends on what it was doing. This is also not a production monitoring platform or a universal manager for system services.
If you primarily need managed Node processes, consider PM2. If your project is a group of containers, Docker Compose is a more natural fit. A personalized dashboard makes sense when your tools already have different launchers and you want a simple visual layer over them.
The bottom line
I built Local Control because making useful tools had outpaced my ability to remember how to run them. A small dashboard restores that context: what the app is, where it lives, how to launch it, and whether its address responds.
Start with one service and verify its lifecycle before adding more. Download the Local Server Dashboard Quick-Start Guide PDF for the setup checklist, architecture diagram, reusable prompt, and troubleshooting reference. If your next project involves local AI, my Mac Mini M4 local AI server guide covers a different part of that workflow.